
Glaze Optimization for Ceramic Slabs and Tiles
.jpg)

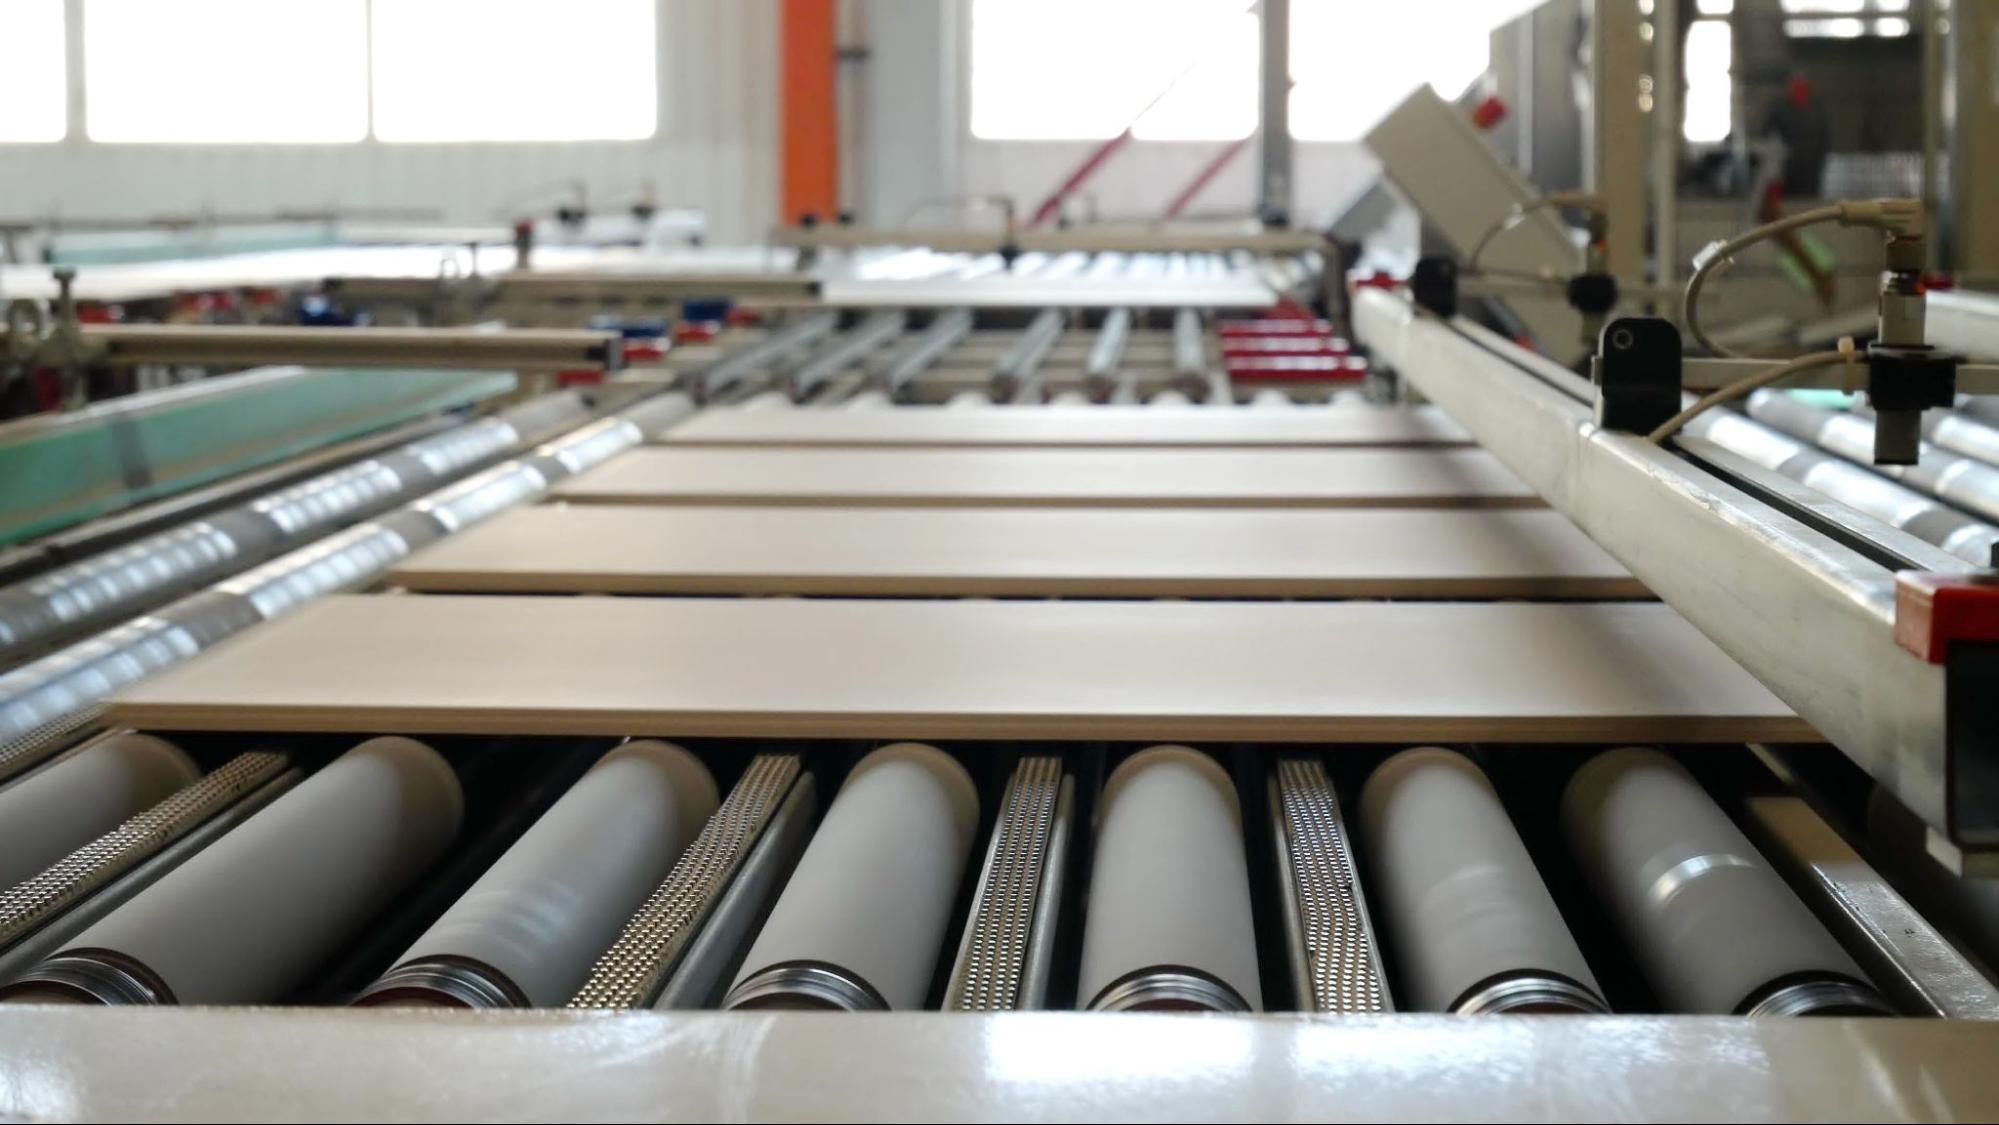
Glazing lines work 24 hours a day with constantly varying raw materials and production parameters. Apart from technical characteristics, the glaze serves as a base for digital printing and has to make maximum possible whiteness.
Intro
Set up a system to track production raw material shipments, incoming analysis and production results and predict outcomes as materials vary. Study the correlation between formulation and chemical composition and the effect on performance parameters (e.g. CIE L*a*b*, gloss, and price). Manage retained laboratory samples and print simple QR codes to enable production workers to switch between batches.
Supply Problem
The chemical composition of supplied minerals and frits for ceramic tiles is constantly changing based on their source. This impacts the behavior of the tile body and various applications on the ceramic slab or tile. One example is the whiteness of the glaze before digital printing.
Process Problem
Tile manufacturing is a 24/7 process, teams are challenged by the need to constantly monitor and explain process variations, with the goal of reducing wastage and increasing yield of A grade product.
Solution: Accessing available data
Chemical compositions of supplied materials are measured by XRF or other analytical techniques and delivered as CoA in PDF formats or even in paper. Formulations are managed by pen and paper notebooks. Some data is managed in Excel.
Data Consolidation (Connect, Ingest, Structure & Enhance)
Digitizing and organizing the chemical composition, formulations, properties and performance parameters of the various components into a unified Materials Knowledge Center reflecting the ongoing variations in supply and product specifications To this center can be added to your whole frits catalog with compositions.
Visual Analyzer
The Visual Analyzer multi-dimensional cross-correlation analysis allows a smart selection of a set of materials with the best formulation performance. In the following graphic, the blue color indicates a positive correlation, while the brownish shades indicate negative correlation.
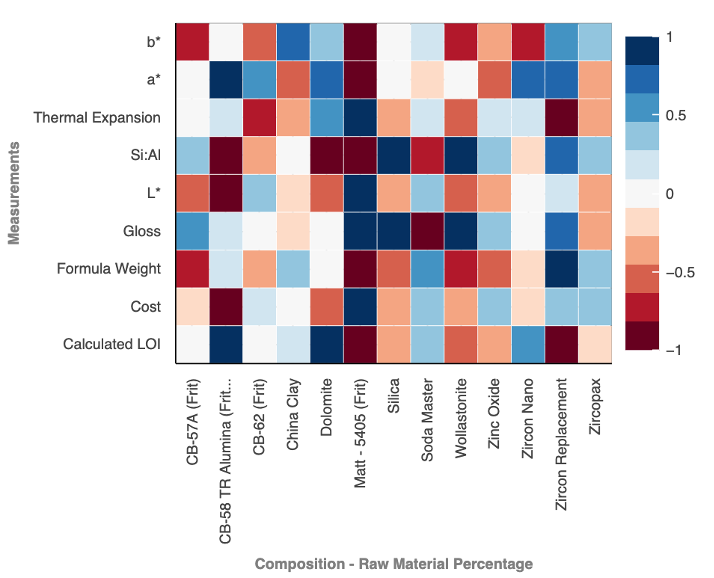
70% fewer experiments with maximal L*, whiteness and desired gloss
